INSIGHTS / GAME MATHEMATICS
Two Slots. Same 96% RTP. Completely Different Player Experience.
Why RTP Is Only the Beginning of Game Mathematics
Imagine two slot games.
Both have exactly the same theoretical Return to Player: 96%.
Both have the same average bet size.
Both operate under the same long-term mathematical constraint.
Yet one delivers frequent small wins and relatively smooth balance fluctuations. The other produces long sequences of losing spins, occasionally interrupted by substantial payouts.
From an RTP perspective, these games are identical.
From a player's perspective, they can feel like completely different products.
This distinction is fundamental to slot development.
RTP tells us how much a game is expected to return over the long run. It does not tell us how that return is distributed.
And distribution is where much of the game experience is created.
1. RTP Is an Expected Value, Not an Experience
For a simplified game with a fixed bet of 1 unit, theoretical RTP can be expressed as:
RTP = Σ [P(i) × Payout(i)]
Where:
- P(i) is the probability of outcome i.
- Payout(i) is the total payout associated with that outcome, including the returned stake where applicable.
For a game with 96% RTP:
E[Payout] = 0.96 units per 1-unit bet.
This means that the expected total payout is 96% of the amount wagered. Actual returns over any finite number of spins can differ substantially.
But this equation does not describe:
- How frequently a spin produces a payout.
- How large typical payouts are.
- How often substantial wins occur.
- How variable the results are.
- How long losing sequences may last.
These characteristics are determined by the underlying probability distribution.
To see why this matters, consider two deliberately simplified mathematical models.
2. Two Mathematical Models With Identical RTP
Assume each spin costs 1 unit and has only two possible outcomes: no payout or a fixed payout.
Slot A — Frequent Wins
- Probability of a payout: 40%.
- Payout on a winning spin: 2.4× bet.
- Probability of no payout: 60%.
Expected payout:
0.40 × 2.4 = 0.96
Theoretical RTP: 96%.
Slot B — Rare, Larger Wins
- Probability of a payout: 8%.
- Payout on a winning spin: 12× bet.
- Probability of no payout: 92%.
Expected payout:
0.08 × 12 = 0.96
Theoretical RTP: 96%.
Both games have the same expected return.
But their statistical behavior is dramatically different.
| Metric | Slot A | Slot B |
|---|---|---|
| Theoretical RTP | 96% | 96% |
| Hit frequency | 40% | 8% |
| Payout on a winning spin | 2.4× | 12× |
| Probability of no payout | 60% | 92% |
| Expected payout per spin | 0.96× | 0.96× |
| Payout standard deviation per spin | ≈1.18× | ≈3.26× |
Slot B has approximately 2.8 times the standard deviation of Slot A in this simplified model.
In other words, the expected return is identical, but the variability around that expectation is not.
These are illustrative probability models, not complete commercial slot mathematics. Real games include multiple payout levels, symbol combinations, bonus states, and other dependencies.
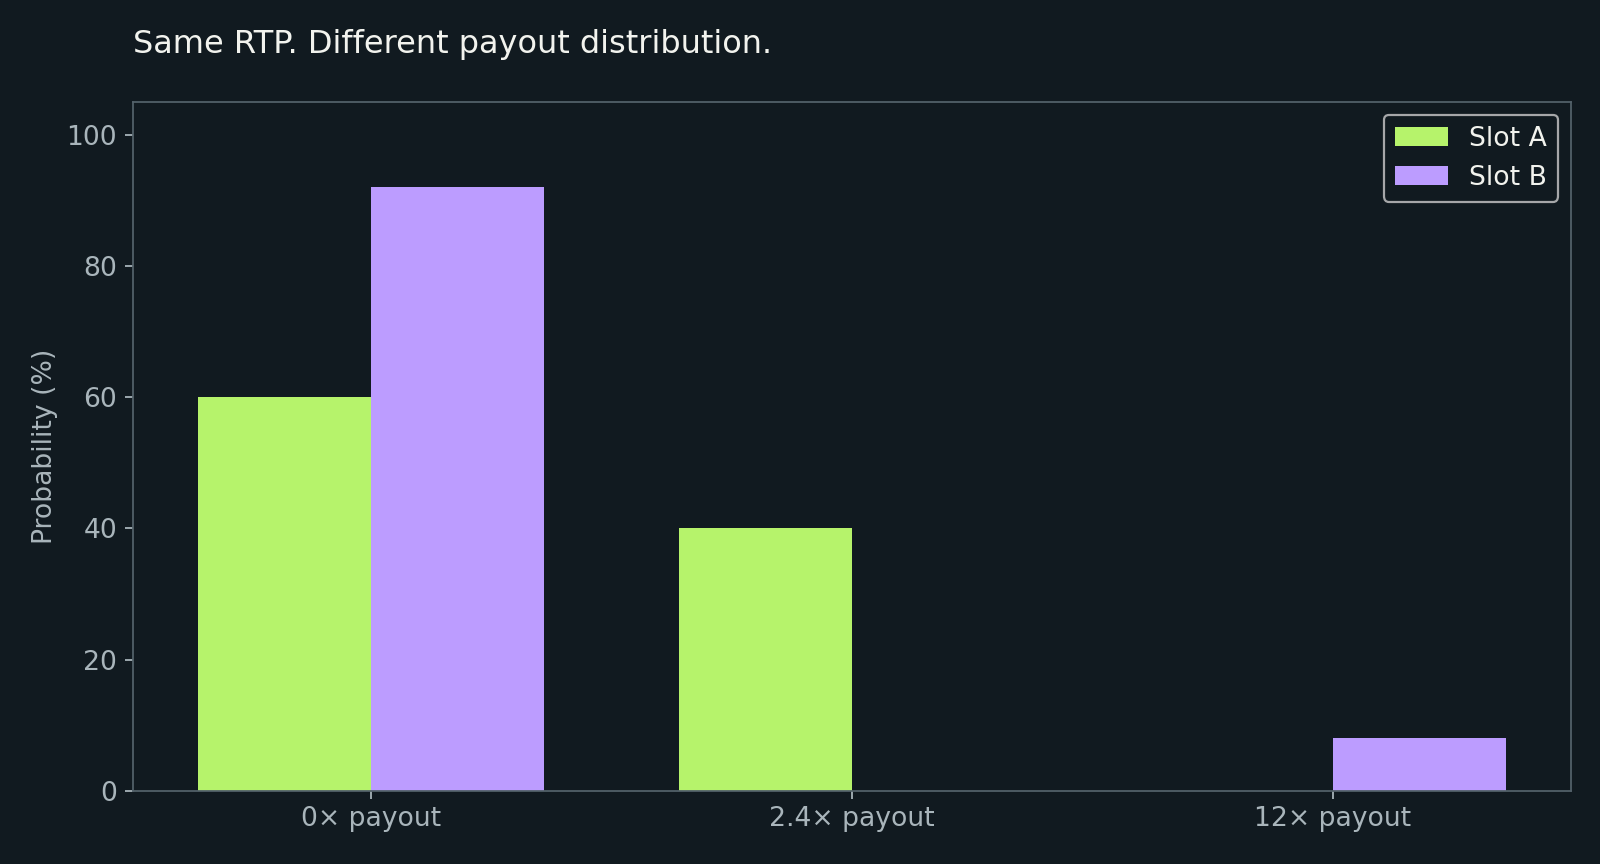
Figure 1. Both models have 96% theoretical RTP, but their payout probabilities differ dramatically.
3. What Happens During a Gaming Session?
Let's examine the probability of consecutive spins without a payout.
For an independent-spin model, the probability of receiving no payout across N consecutive spins is:
P(No Payout in N Spins) = (1 − Hit Frequency)ᴺ
For 10 consecutive spins:
Slot A:
0.60¹⁰ ≈ 0.6%
Slot B:
0.92¹⁰ ≈ 43.4%
This is an enormous difference.
In Slot A, a specified sequence of ten consecutive spins without a payout is relatively unlikely.
In Slot B, the same sequence has a probability of more than 40%.
Notice what this means.
Two games can have identical theoretical RTP, while the likelihood of experiencing ten consecutive spins without a payout differs by more than 70 times.
That is not a minor mathematical detail.
It changes the statistical texture of a session.
However, these figures describe a specified ten-spin sequence, not the probability of encountering such a sequence somewhere during a longer session. That requires a separate calculation.
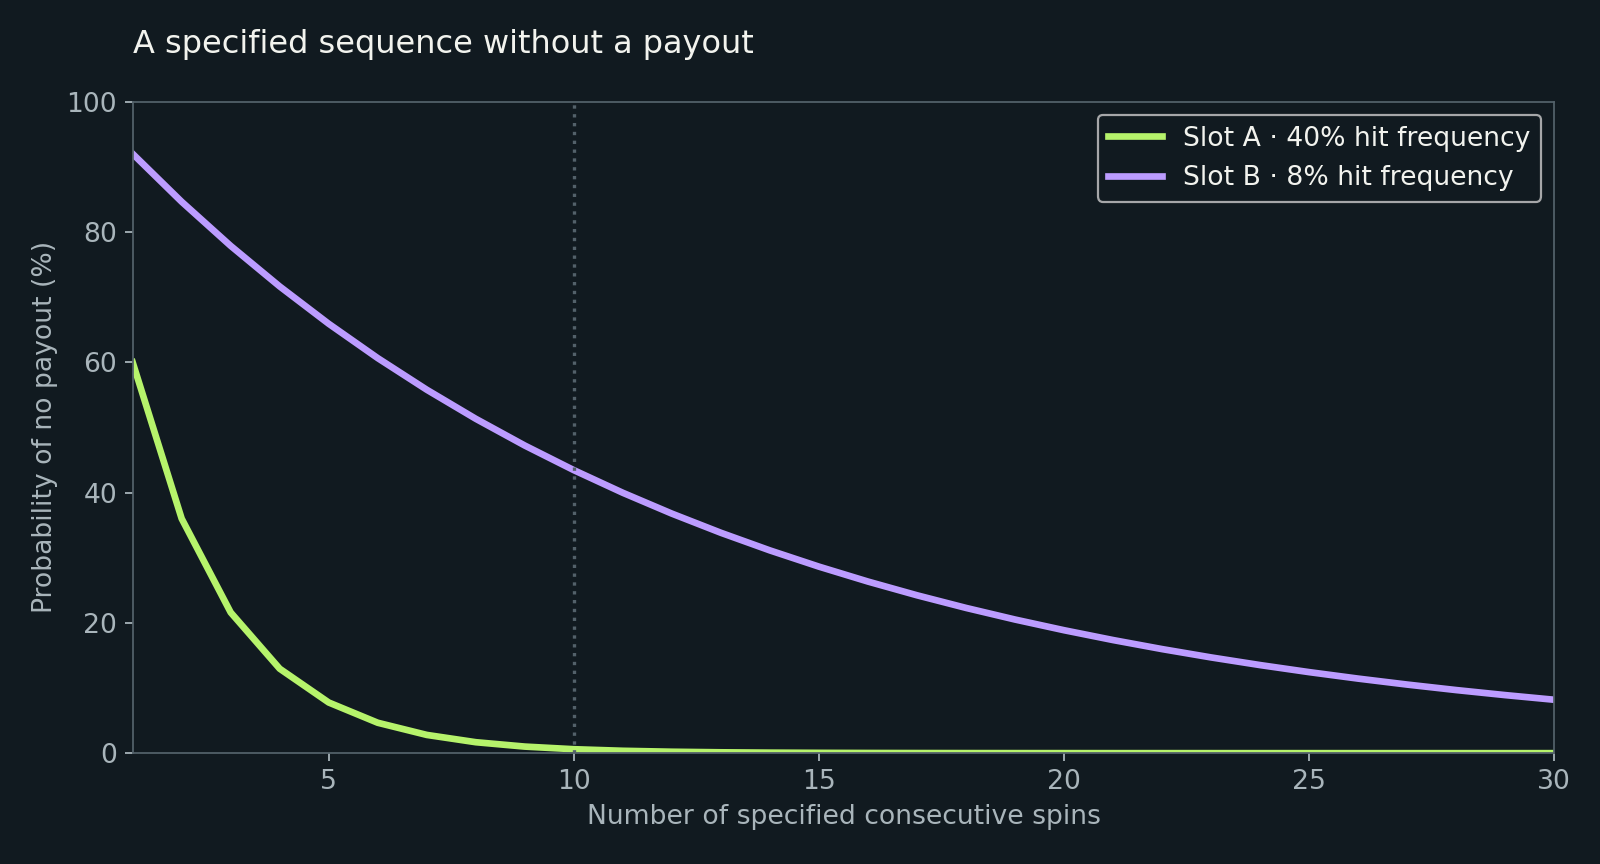
Figure 2. The probability of a specified sequence of spins without a payout, assuming independent outcomes.
4. Volatility Is More Than a Label
In the industry, we frequently describe slots using labels such as low, medium, or high volatility.
These labels are useful for communication, but they are not a universal mathematical standard.
Different providers may classify volatility differently.
For a more rigorous comparison, we should examine measurable characteristics of the payout distribution.
One useful measure is variance:
Var(Payout) = E[Payout²] − E[Payout]²
For our simplified examples:
Slot A:
Var = 0.40 × 2.4² − 0.96²
Var = 1.3824
Slot B:
Var = 0.08 × 12² − 0.96²
Var = 10.5984
The difference is substantial.
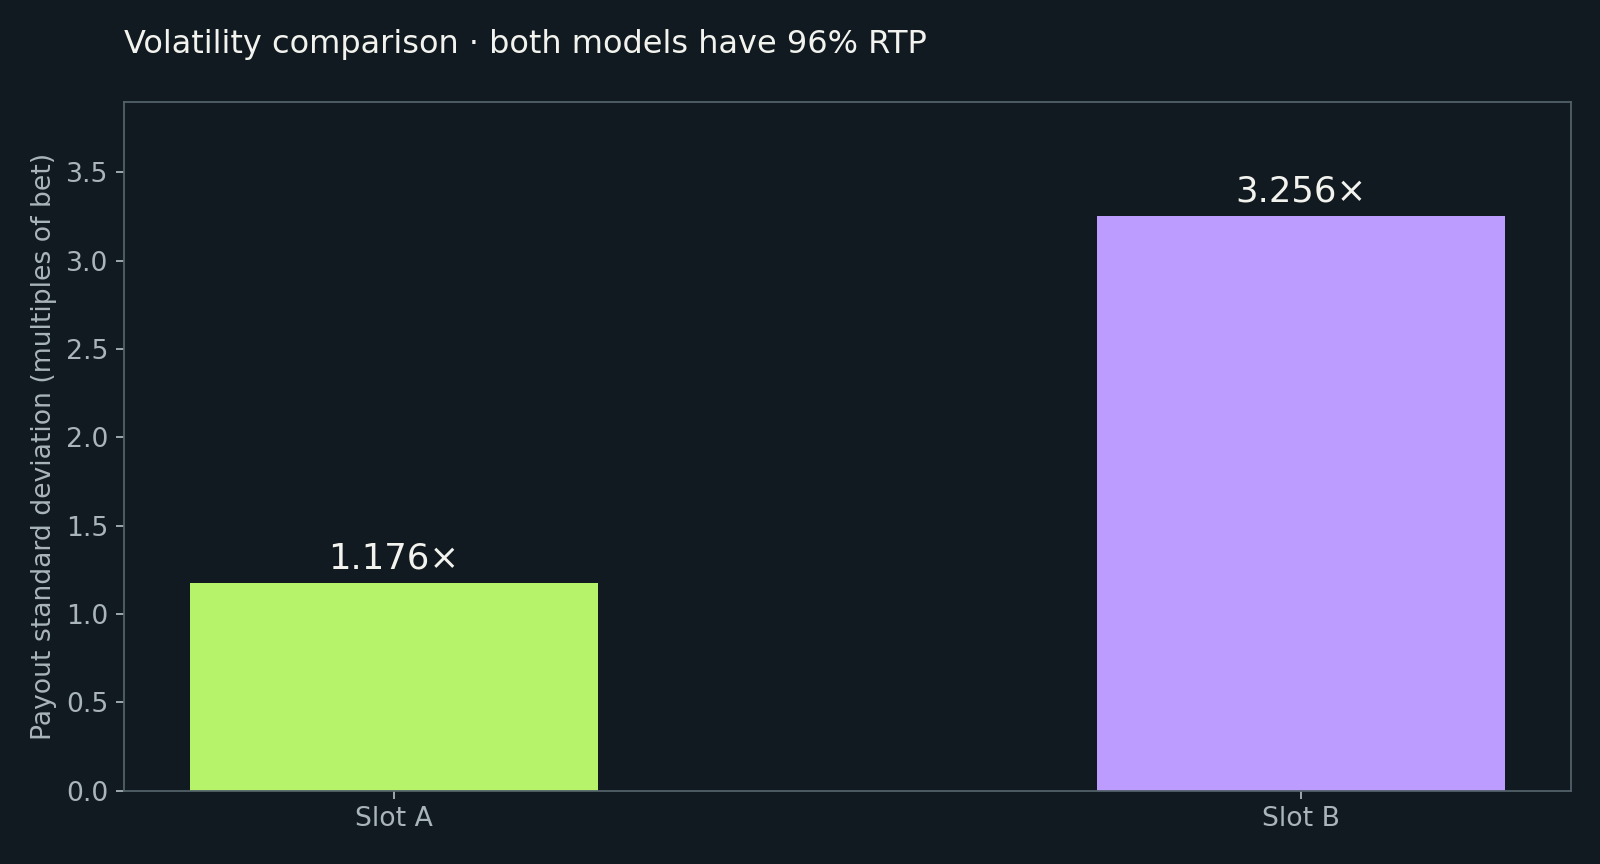
Figure 3. The standard deviation of Slot B's payout is approximately 2.8 times higher than Slot A's, despite identical theoretical RTP.
But variance alone is not sufficient to describe every relevant characteristic of a slot.
In real game development, I would also want to understand:
- Hit frequency across different payout thresholds.
- Contribution of base-game and bonus-game wins to total RTP.
- Frequency and distribution of bonus events.
- Tail probabilities for large payouts.
- Maximum exposure and payout concentration.
- Distribution of session-level outcomes under defined assumptions.
Together, these measures provide a much more useful picture than RTP and a single volatility label.
5. The Product Implications
Why should product managers care about these mathematical details?
Because a slot is not experienced as an expected value.
It is experienced as a sequence of outcomes.
Players encounter wins, losses, anticipation, uncertainty, and occasional exceptional events.
The mathematical distribution determines the probabilities of those events.
But we should be careful about the conclusions we draw.
A higher hit frequency does not automatically mean better retention.
Likewise, a higher-volatility game does not automatically produce stronger engagement.
Actual player behavior depends on many factors, including game presentation, market context, player preferences, session conditions, and the broader product environment.
The right approach is to connect mathematical characteristics with observed behavior rather than assume that one particular distribution is universally superior.
For example, when comparing game models, product teams can investigate:
Session behavior: How do different payout distributions relate to session duration and stopping patterns?
Player segmentation: Do different cohorts respond differently to the same mathematical characteristics?
Bonus experience: How do bonus frequency and payout concentration affect the distribution of outcomes?
Product performance: How do observed results compare after accounting for acquisition sources, player mix, and other confounding variables?
These are empirical questions.
They require behavioral data, appropriate experimental design, and careful interpretation.
6. The Next Step: Modeling Before Launch
There is another reason I find this subject particularly interesting.
We can simulate a mathematical model before releasing a game.
Monte Carlo simulations allow us to generate large numbers of possible outcome sequences and examine:
- The distribution of returns over finite sessions.
- The frequency of specific payout events.
- The probability of different drawdowns.
- Sensitivity to starting balance and bet size.
- Differences between alternative mathematical configurations.
This can help identify how a game behaves statistically before it reaches production.
But mathematical simulation and player-behavior simulation are not the same thing.
A Monte Carlo model can tell us what outcomes are possible and how likely they are under its assumptions.
It cannot, by itself, tell us how real players will react.
For that, we need behavioral evidence and, potentially, more sophisticated models such as agent-based simulation or player Digital Twins.
Even then, the quality of the predictions depends on the quality of the assumptions and validation.
7. Beyond RTP
When developing a slot, achieving the target RTP is only one part of the challenge.
The deeper questions are:
How is that RTP distributed?
What does the distribution imply for different session lengths?
How do base-game and bonus-game mechanics interact?
And how do we evaluate whether the resulting experience matches the product's intended design?
Two slots with the same 96% RTP can have dramatically different statistical characteristics.
That is why I believe game mathematics should be discussed as more than a compliance figure or a number in the game information screen.
RTP defines the expected return.
The payout distribution defines the statistical behavior.
Player research and product analytics help us understand the experience.
And good game development requires all three.
Go Beyond RTP
Interested in the mathematics, mechanics, and product decisions behind casino games?
I explore slot mathematics, player behavior, product strategy, and AI-driven game development in Beyond RTP | Polubabkin.
Join the conversation on Telegram:
Evgeny Polubabkin — Product & Technology Leader | iGaming | Game Mathematics | Product Strategy
Charts calculated from the illustrative models in this article. They do not represent observed commercial game or player data.