INSIGHTS / GAME MATHEMATICS
Why RTP Alone Cannot Explain Player Experience
Understanding median returns, payout distributions, and the difference between mathematical performance and player behavior.
Evgenii Polubabkin · 12 November 2026 · 6 min read
In slot development, Return to Player (RTP) is one of the most familiar metrics. It is central to game mathematics, certification, and the evaluation of theoretical returns.
But RTP answers a specific question: what proportion of wagered value is expected to be returned over a sufficiently large number of game events?
It does not tell us what a typical player will experience during a particular session, how individual bonus purchases will perform, or whether a game will be perceived as engaging.
That distinction becomes especially important when designing high-volatility slots and Buy Bonus features.
1. The Difference Between Expected Return and Typical Outcome
Consider two hypothetical Buy Bonus configurations.
Both have a theoretical RTP of 95%, measured against the cost of purchasing the feature.
For every €100 spent on purchases, each configuration has an expected payout of €95.
Yet their payout distributions can be fundamentally different.
Game A could deliver relatively frequent moderate payouts, with a smaller share of its RTP coming from rare large wins.
Game B could deliver many low-paying bonuses while allocating a much larger share of its expected return to rare, high-multiplier outcomes.
Both configurations can be mathematically correct. Both can have the same RTP.
But their typical purchase outcomes may be very different.
A player purchasing ten bonuses does not experience the theoretical expectation directly. They experience ten individual results drawn from a payout distribution.
This is why RTP, while essential, is insufficient to describe the experience of a bonus feature.
2. Mean Return vs. Median Return
The mean and median are often confused when evaluating game performance.
The mean return represents the mathematical average of all outcomes, weighted by their probabilities. RTP is based on this expected value.
The median return is the 50th percentile of the outcome distribution: half of the outcomes fall at or below that value, and half at or above it.
In a highly skewed distribution, the mean may be substantially higher than the median.
Imagine a simplified hypothetical bonus distribution:
| Outcome | Probability | Return |
|---|---|---|
| Low payout | 60% | 20% |
| Moderate payout | 30% | 100% |
| Large payout | 10% | 530% |
The expected return is:
(0.60 × 20%) + (0.30 × 100%) + (0.10 × 530%) = 95%
But the median return is only 20%.
This is an intentionally simplified example, not a proposed commercial slot configuration. It illustrates how rare large payouts can raise the mean while most purchases return considerably less than their cost.
The result is not a mathematical contradiction. It is a consequence of the distribution.
For game designers, the important question is not whether one metric is more correct than another.
It is what each metric tells us — and what it leaves out.
Same RTP, Different Outcomes
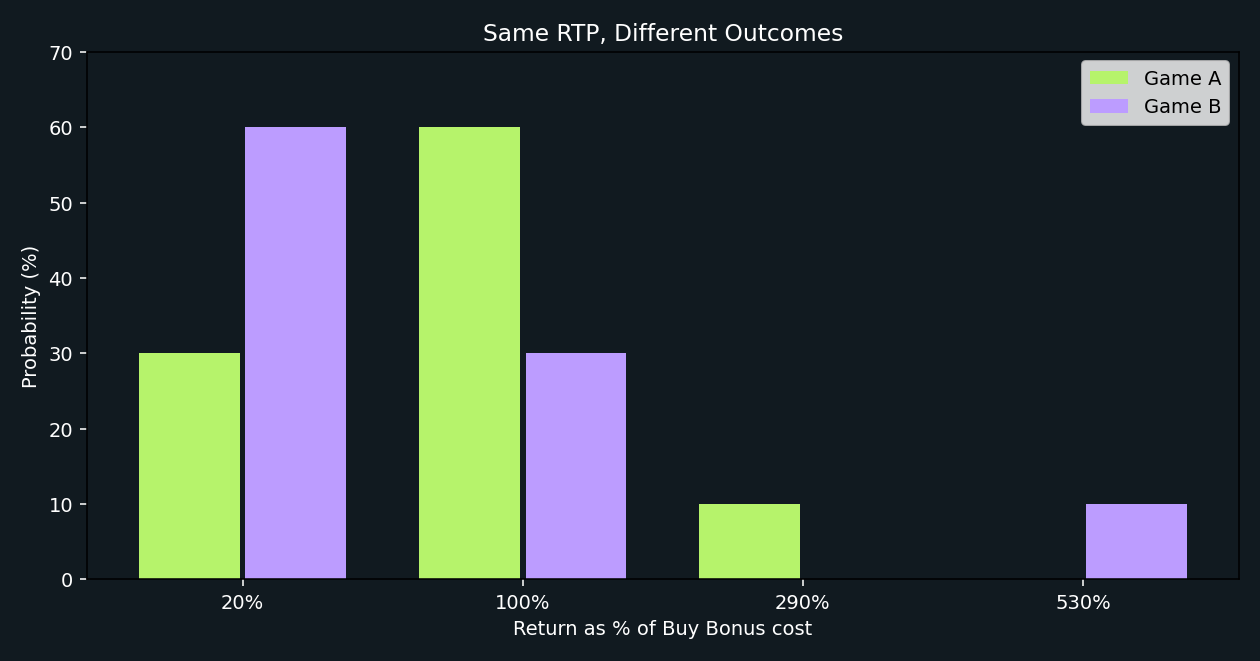
| Return | Game A probability | Game B probability |
|---|---|---|
| 20% | 30% | 60% |
| 100% | 60% | 30% |
| 290% | 10% | 0% |
| 530% | 0% | 10% |
3. Why the Full Payout Distribution Matters
When evaluating Buy Bonus mathematics, I would examine several metrics together:
- Median return: the outcome at the 50th percentile.
- Break-even frequency: the probability that a purchase returns at least its cost.
- Low-return probability: the frequency of outcomes below a defined threshold, such as 25% of the purchase cost.
- High-multiplier frequency: the probability of returns exceeding 2×, 5×, or other relevant thresholds.
- Tail contribution to RTP: how much of the expected return comes from rare, exceptionally large payouts.
- Variance and higher percentiles: how widely outcomes are distributed and how extreme the upper tail can be.
These metrics should not be optimized independently.
Increasing the frequency of break-even outcomes while holding RTP constant requires compensating changes somewhere else in the distribution.
Similarly, increasing the median does not automatically improve every aspect of the mathematical profile.
The design problem is multidimensional: RTP, distribution shape, volatility, maximum exposure, and feature behavior are interconnected.
A mathematical model should therefore be evaluated as a distribution of possible outcomes, not simply as a single expected-return percentage.
4. The Same RTP Does Not Mean the Same Volatility
RTP and volatility describe different properties.
RTP measures expected return.
Volatility describes the variability of results around that expectation, although the exact volatility metric and reporting convention can differ between studios.
Two games with the same RTP can have different volatility.
More importantly, even two distributions with the same mean and variance do not necessarily have the same shape.
They may differ in their medians, probabilities of near-zero returns, break-even frequencies, or extreme payout tails.
This matters particularly in bonus features where outcomes are heavily skewed.
A volatility label such as “high” or “very high” cannot communicate all these differences.
For meaningful mathematical comparison, designers need to examine the underlying probability distribution.
5. Where Mathematics Meets Player Behavior
This is where the discussion becomes more interesting.
A game mathematics model can establish the probabilities of outcomes. It cannot, by itself, establish how players perceive those outcomes.
Different players may respond differently to payout frequency, long losing sequences, feature anticipation, and the presentation of wins.
Even when two games produce mathematically similar results, differences in pacing, audiovisual feedback, bonus presentation, and player expectations may influence the experience.
But these are behavioral hypotheses, not conclusions that can be established from RTP calculations.
To investigate them, we need appropriately collected observational data, controlled experiments where feasible, and measures that go beyond financial outcomes.
We also need to distinguish correlation from causation.
For example, if one slot has higher repeat visitation than another, that difference might reflect game design, but it could also be influenced by player selection, placement, promotion, or other contextual factors.
Mathematical simulation tells us what a game can produce.
Behavioral research helps us understand what people actually experience.
6. Could Player Digital Twins Bridge the Gap?
One possible future direction is to connect mathematical simulation with behavioral modeling.
Traditional Monte Carlo simulations generate large samples of game outcomes to estimate RTP, volatility, payout frequencies, and other mathematical properties.
A behavioral simulation would attempt something different.
It would model how different types of players might respond to those outcomes and to changes in the game experience.
For example, synthetic player agents could be constructed from appropriately collected historical data and used to explore hypotheses about feature preferences, session decisions, or reactions to different payout distributions.
However, a synthetic population is not automatically representative of real players.
A model involving 10,000 synthetic agents does not become reliable simply because it contains 10,000 agents.
Its value depends on the quality of its underlying data, its assumptions, and its ability to predict observations that were not used to build it.
A credible validation process would include:
- Calibration against historical player behavior.
- Testing on separate, previously unseen time periods or player cohorts.
- Comparison with simpler statistical baselines.
- Measurement of predictive uncertainty and failure cases.
- Continued recalibration when behavior or market conditions change.
Without that evidence, Player Digital Twins should be treated as exploratory tools for generating hypotheses, not as proven predictors of commercial game performance.
7. Responsible Design Is Part of the Equation
Understanding player behavior also creates responsibilities.
The ability to identify behavioral patterns must not become a mechanism for exploiting vulnerable players or encouraging harmful gambling behavior.
Predictive systems should incorporate privacy safeguards, appropriate data governance, and responsible gambling objectives.
Their outputs can be used to investigate potentially harmful experiences, improve risk detection, and evaluate whether design changes create unintended negative consequences.
A mathematically valid game is not automatically a responsible or successful product.
These are separate dimensions that need to be evaluated explicitly.
Conclusion: RTP Is the Starting Point, Not the Complete Answer
RTP remains a foundational metric in slot development.
It tells us whether the mathematical model produces the intended expected return.
But it does not describe the typical bonus purchase, the complete payout distribution, or the response of real players.
For a more complete understanding, studios need to connect three layers:
Three Layers of Game Evaluation
- Game Mathematics
Possible outcomes and their probabilities. - Outcome Distribution Analysis
Typical returns and payout tails. - Behavioral Validation
Measured player responses and reliability of evidence.
The next step in slot development is not to replace RTP with another single metric.
It is to stop expecting one metric to explain an entire player experience.
Evgenii Polubabkin
iGaming Product & Technology Leader | Beyond RTP
Exploring the intersection of game mathematics, player behavior, and AI-driven product development.
Related Insights
About the Author
Evgenii Polubabkin works in iGaming product and technology leadership, with more than 15 years of experience across product, engineering and operations.
Evgenii Polubabkin on LinkedIn ↗